Case study · Capital allocation
GM won the decade. Its returns fell every single year.
A ten-year return-on-capital study of GM, Ford and Stellantis (FY2016–FY2025), built end to end from 62 SEC filings, with the captive finance arms taken out to measure the car business itself.
13.9%
GM: 10-year ROIC, capital-weighted
11.0%
Stellantis (FCA before 2021)
-2.6%
Ford
62
SEC filings parsed, ~160K XBRL data points
Findings
The best allocator, in steady decline
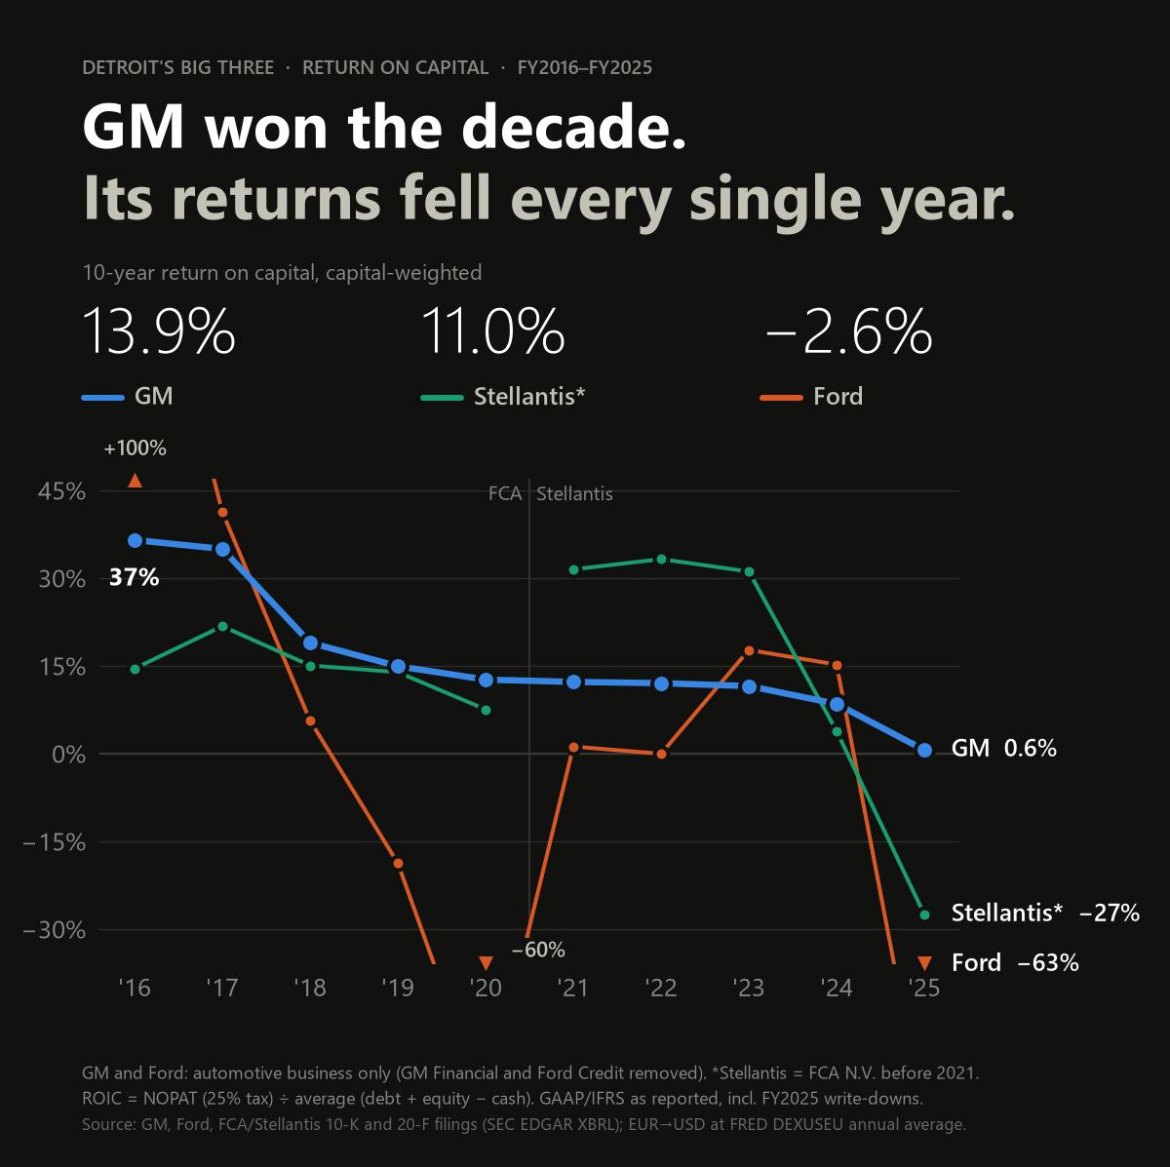
GM was Detroit’s best capital allocator of the past decade, with a 13.9% capital-weighted return on invested capital, ahead of Stellantis at 11.0% and Ford at −2.6%.
But GM’s return also fell every single year, from 37% in FY2016 to 0.6% in FY2025. FY2025 was hard on all three once write-downs are included: Ford fell to −63% and Stellantis to −27%.
The hard part was comparability. GM Financial and Ford Credit carry 84–91% of their parents’ debt, so leaving them in would bury the car business under a lender’s balance sheet. I took them out to measure automotive returns on their own.
- ROIC
- NOPAT (25% tax) ÷ average (debt + equity − cash)
- Scope
- GM and Ford: automotive only (GM Financial and Ford Credit removed). Stellantis = FCA N.V. before 2021
- Accounting
- GAAP / IFRS as reported, including FY2025 write-downs
- Sources
- 10-K and 20-F filings via SEC EDGAR XBRL; EUR→USD at the FRED DEXUSEU annual average
- Completed
- September 2026
- Tools
- Python, Excel
Chart
Return on capital, FY2016–FY2025
Method
Built end to end, then checked
-
01
Parse the filings
A Python pipeline pulls ~160K XBRL data points from 62 10-K and 20-F filings on SEC EDGAR.
-
02
Separate the lenders
GM Financial and Ford Credit, 84–91% of parent debt, are removed so ROIC measures the automotive business.
-
03
One definition for all three
NOPAT at a 25% tax rate over average debt plus equity minus cash; Stellantis converted to US dollars at the FRED annual average.
-
04
Rebuild it in Excel
A 1,898-formula Excel model with sensitivity analysis, matched to the Python output with zero mismatches.
-
05
Check against the source
21 of 21 spot checks against the original filings passed.
1898
formulas in the Excel model
0
mismatches against the Python output
21/21
spot checks passed against the filings
10
fiscal years, FY2016–FY2025
Want to go through the model?
Email me and I’ll walk you through the data pipeline, the adjustments and the checks.